Introduction to CloudWatch
CloudWatch is a service that can monitor the AWS resources (like EC2, ELB, EBS, Snapshot, etc.) and allows you to record the metrics for the different AWS services/resources.
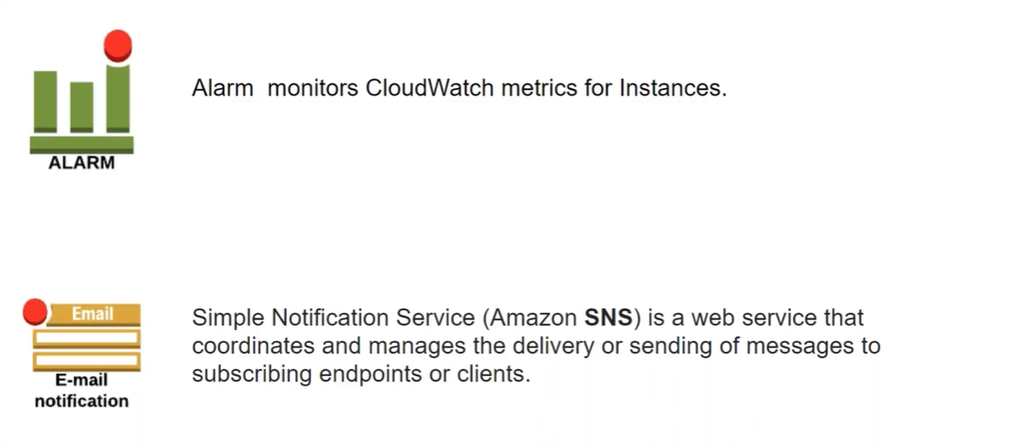
We already have metrics in CloudWatch, and so we can set up alarms in that and alarms are going to check the metrics and if it crosses the threshold level then it will send an email to the right recipients using SNS service.
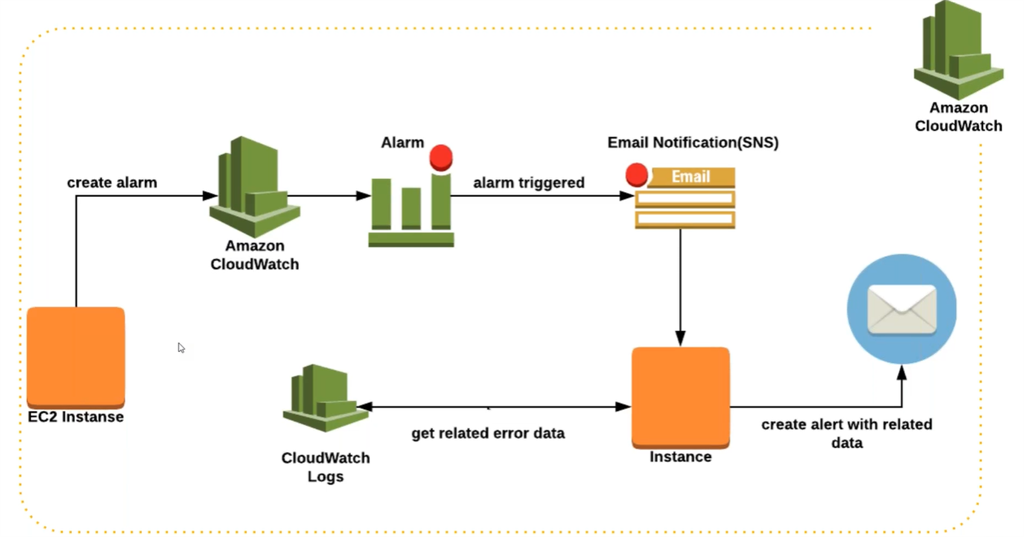
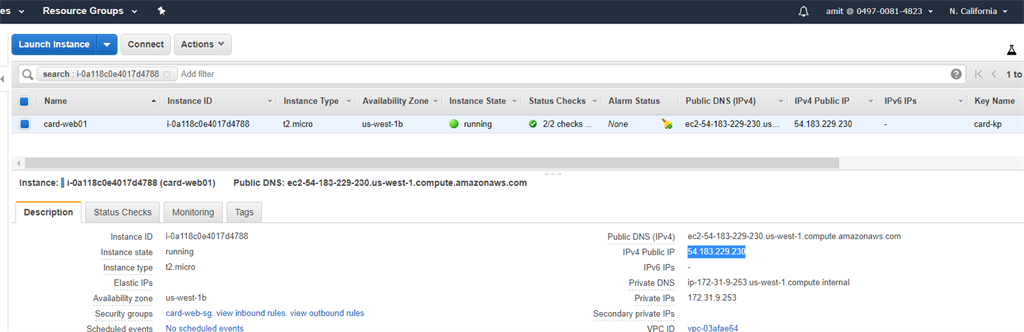
CloudWatch not only monitors the metrics but we can also stream any type of logs through CloudWatch service. So now let’s get started with setting up the alarm for one of the instances which we named as card-web01, which we have created in one of the previous article of ELB.
For example, we can monitor the EC2 instance using the monitoring tab.
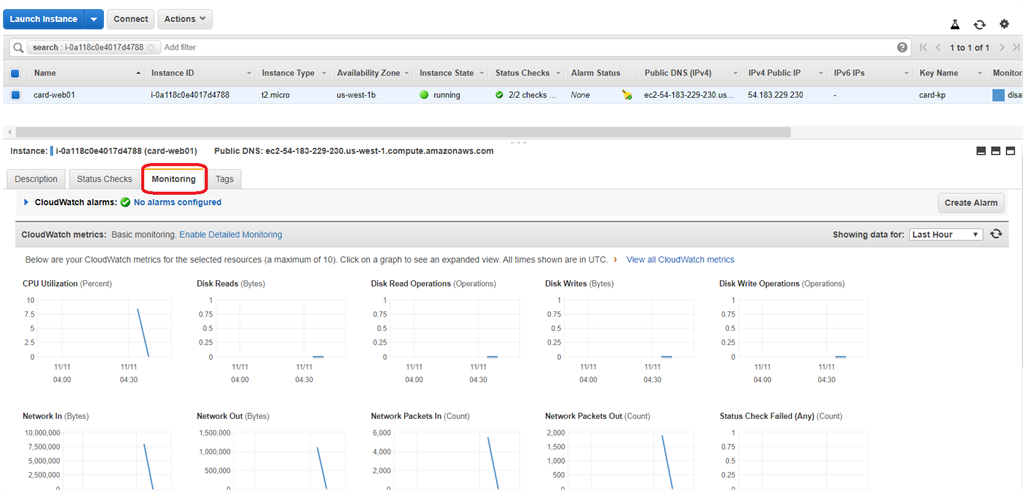
Here, by default we have lots of charts showing the different statistics for the EC2 instance card-web01.CloudWatch monitors your EC2 instance every 5 mins, but if we want to make it monitor it at shorter interval, then we will have to Enable Detailed Monitoring and this is not free.
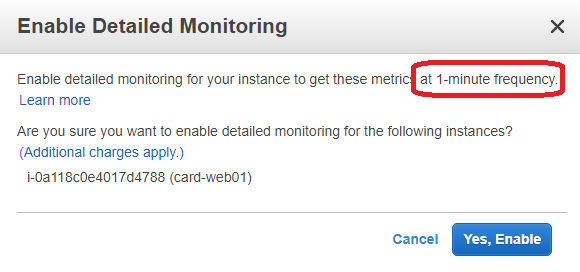
Frequency to monitor the resource is different for different types of resources.
Now let’s go to the CloudWatch dashboard and if we go to the metrics tab, we can see the different services (ELB, EBS, and EC2) which we have used in the North California region and the metrics available for each of them.
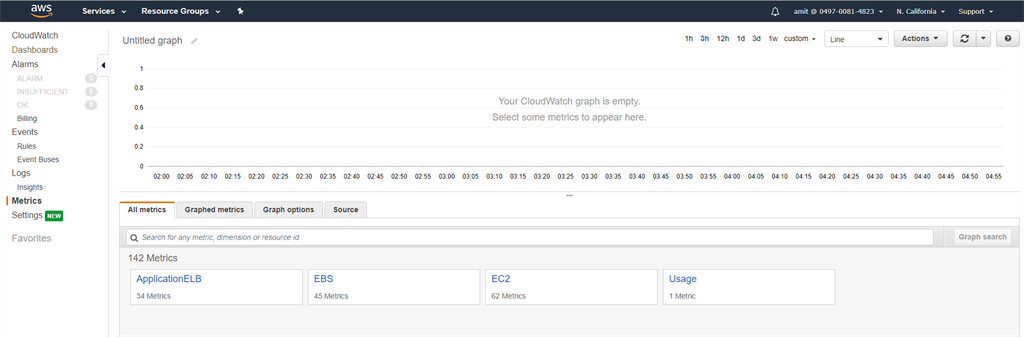
As now we are concerned with the monitoring of EC2 instance, so we will click on EC2 -> Per Instance metrics -> Will select CPU Utilization for the instance card-web01 in North California region.
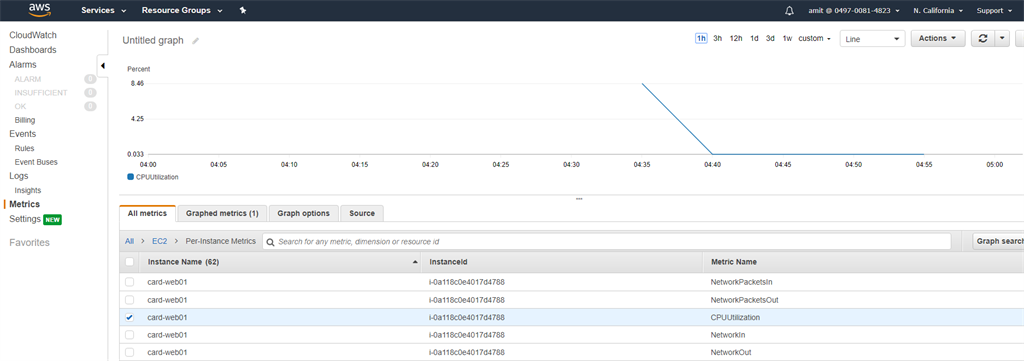
We can see from the graph it generates the CPU utilization in the last 1 hour.
We may need to show the graph generated to the customers or clients, but what if you have 100s of such instances. So, going to each and every instance and then monitoring is not possible. We should have an alert or alarm system if something is not going as expected.
Setting up Alarm on EC2 Instance for CPU Utilization
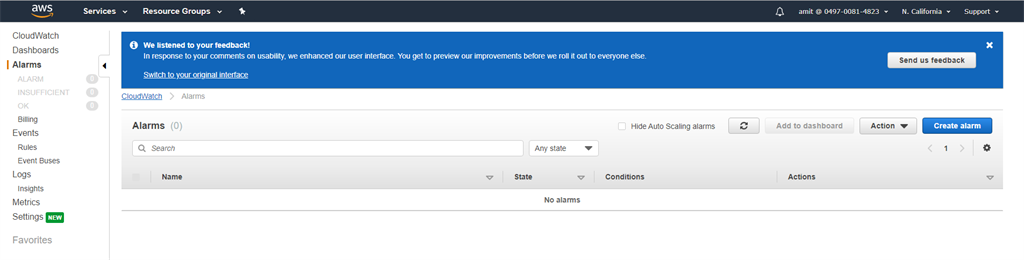
Go to Alarms section in CloudWatch Dashboard and click on Create Alarm.
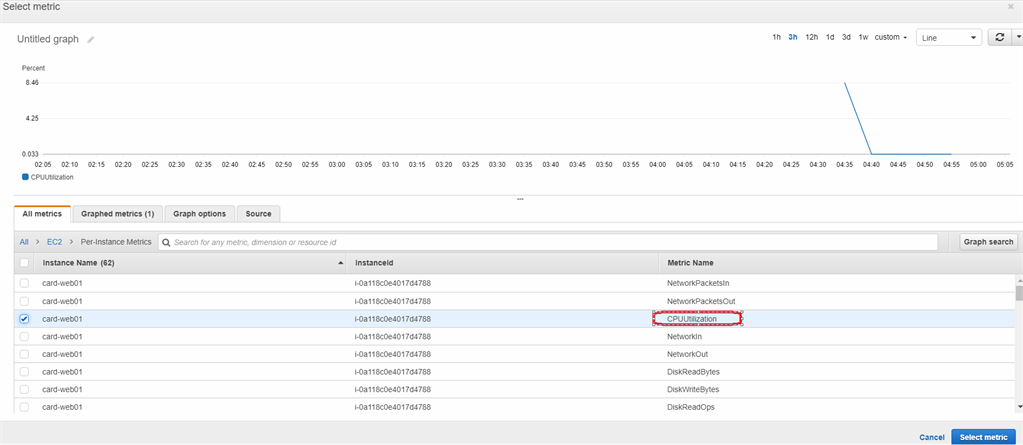
Then select per Instance metrics (CPU Utilization for example) for the EC2 service.
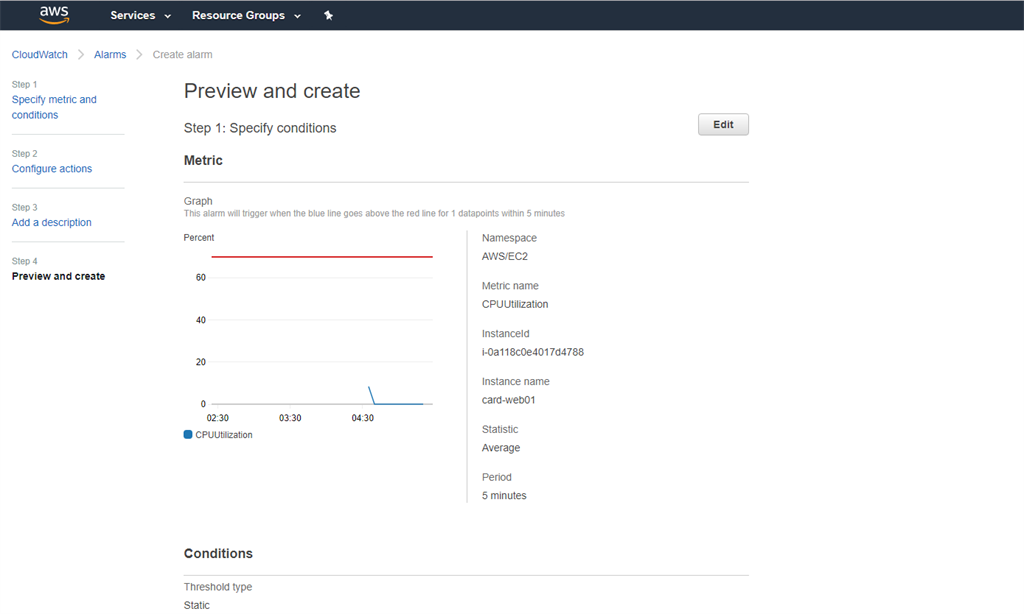
Then we need to specify the metrics and conditions which can be seen in the below images.
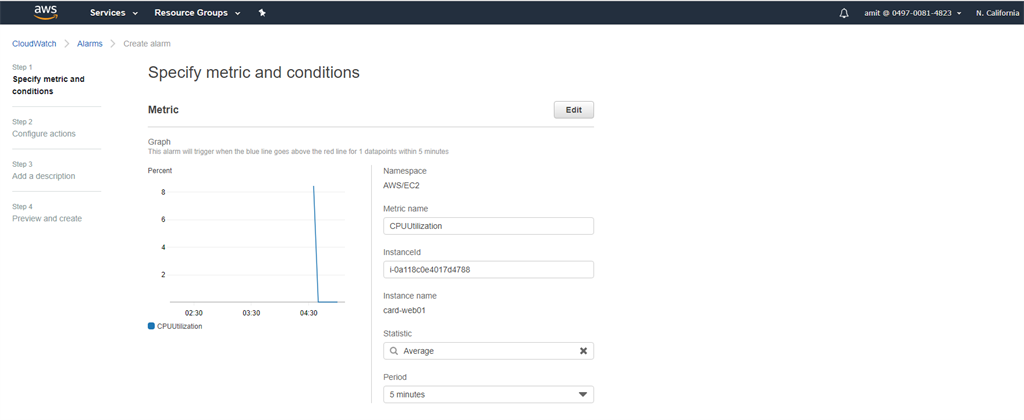
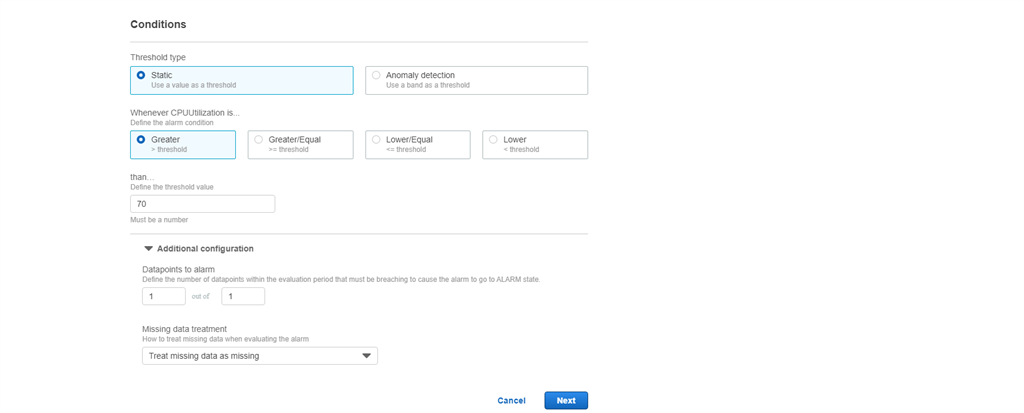
So now we are saying that if the CPU Utilization is greater than 70 % then we have to configure actions.
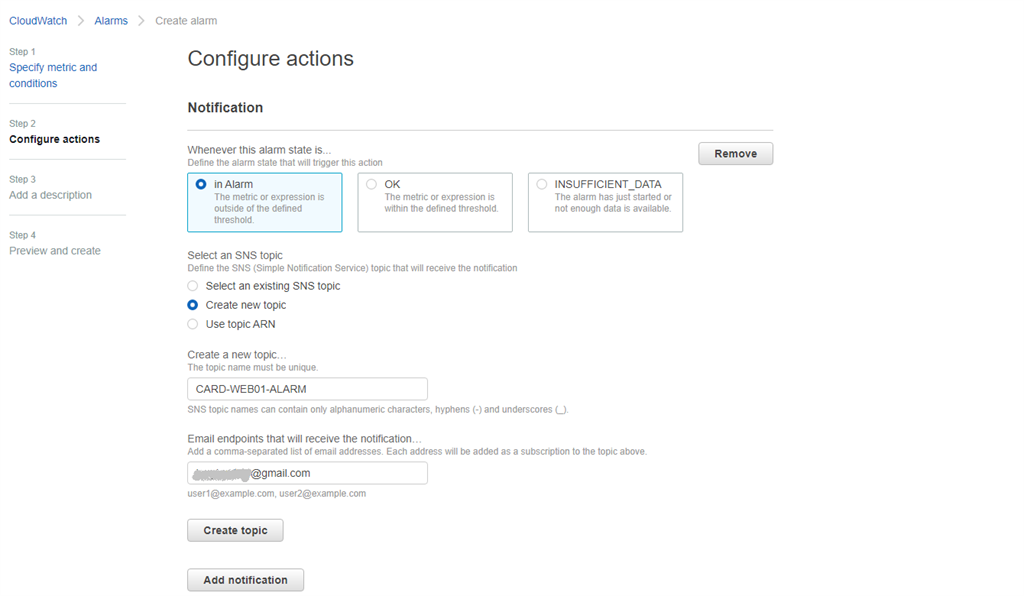
Here we created a new topic to send an alarm to an email Id which could be the group email Id of the monitoring team.
So, our notification has been set up successfully. Now we will select the action for the EC2 instance if the instance is in the alarm state.
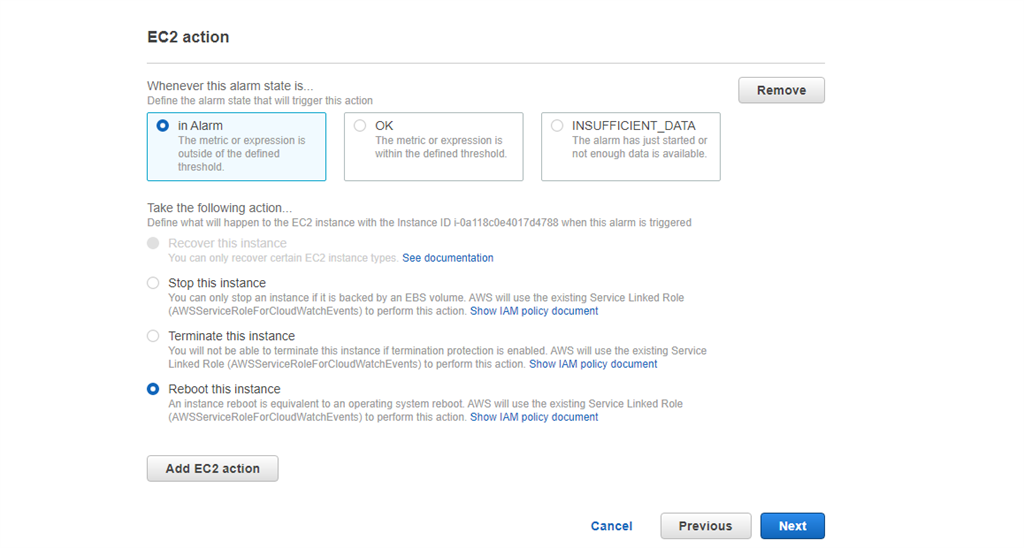
Then finally will click Next and will add the description.
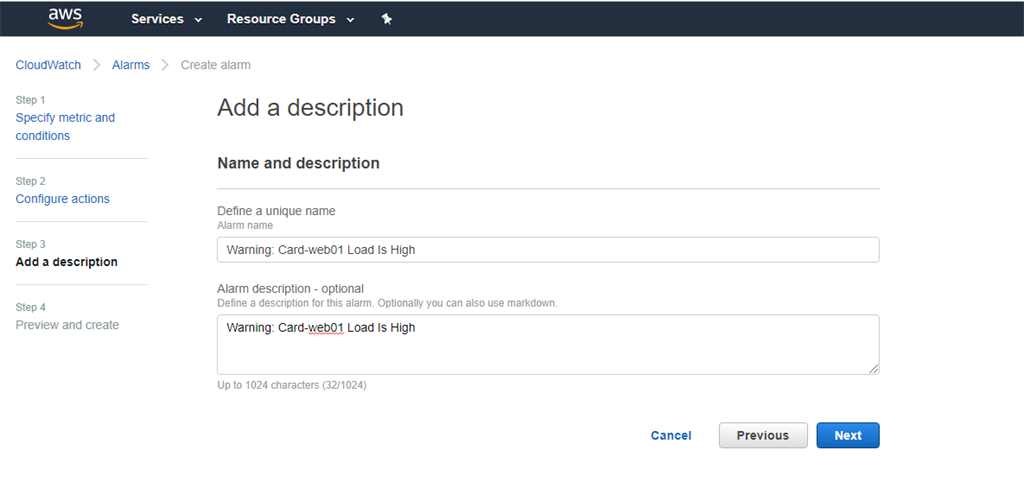
Now hit next and preview the set up and create alarm. Red Line indicates the threshold level of 70% of CPU Utilization.
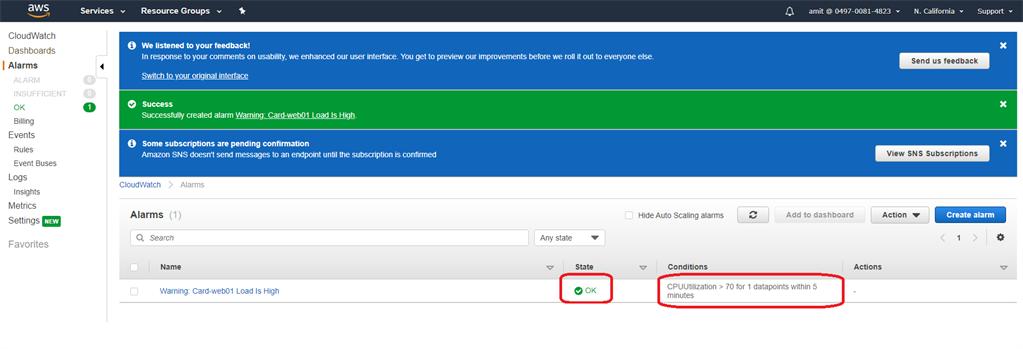
So, we can see that alarm has been created but it shows pending confirmation, because I have given an email address to subscribe to the alerts.
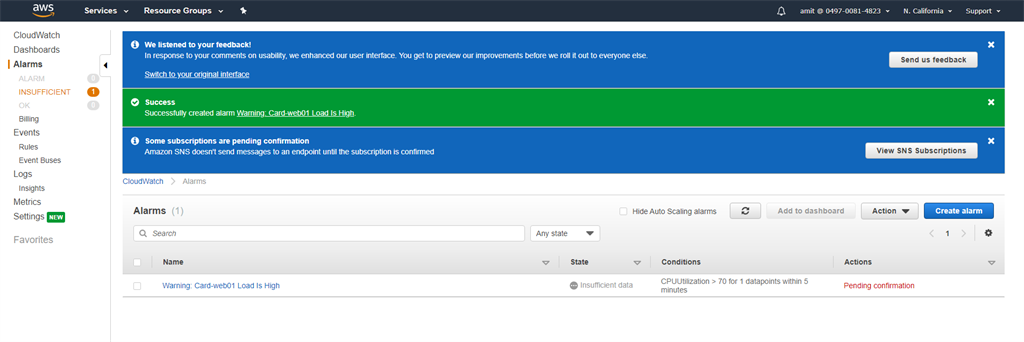
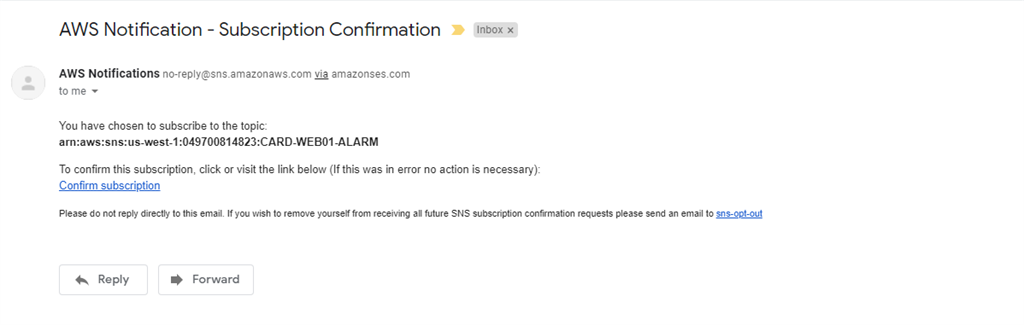
Thus, we need to give confirmation to subscribe to the topic CARD-WEB01-ALARM which we just created.
Post confirmation.
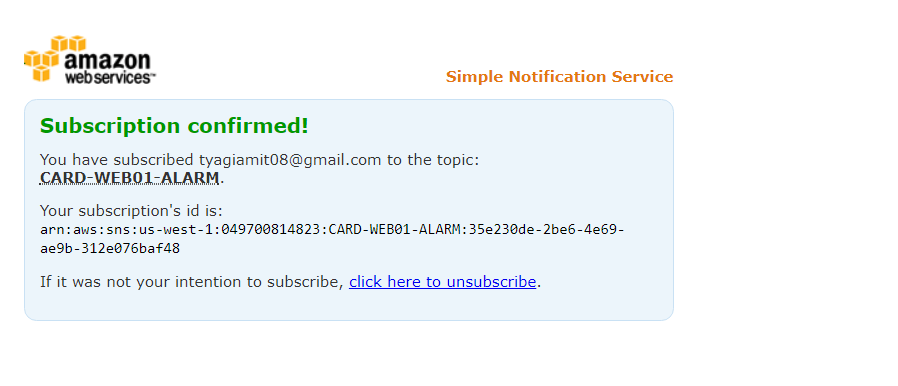
We can see that the State of the alarm is OK which means the CPU Utilization is below the threshold level of 70% for card-web01 EC2 Instance.
Spike Load on EC2 instance acting as Server
Now to trigger the alarm we need to increase the load on the instance so that it crosses 70% of CPU Utilization threshold. For that there are different tools available, we are going to use stress. Below are some of the commands:
sudo -i
apt install stress -y 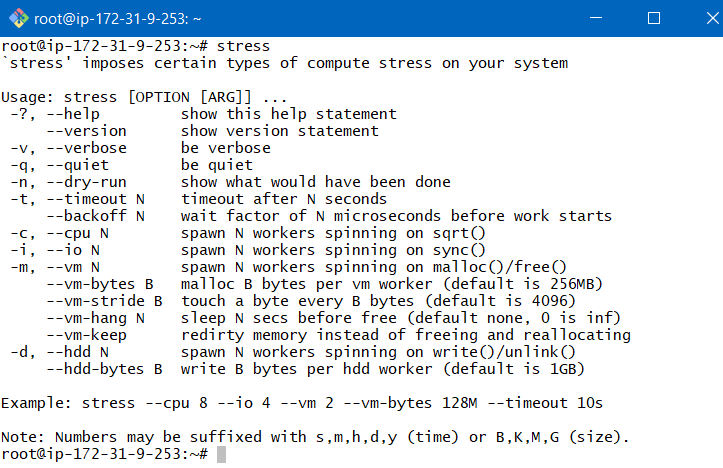
We are now going to stress this instance by increasing the CPU utilization for 500 seconds.
stress -c 1 -t 500 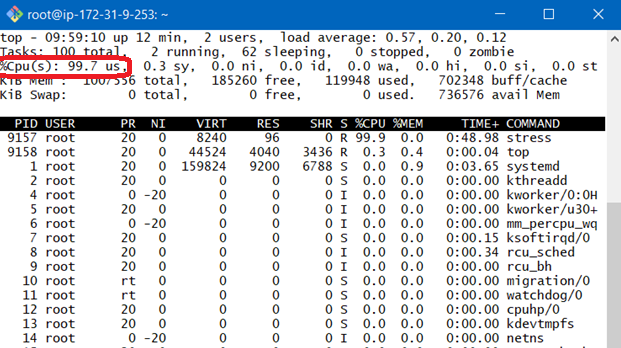
We can see above CPU utilization has gone to 99%, Ideally alarm should be raised.
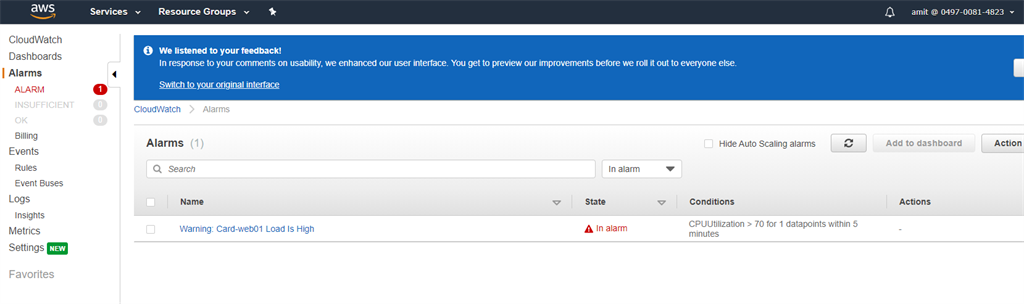
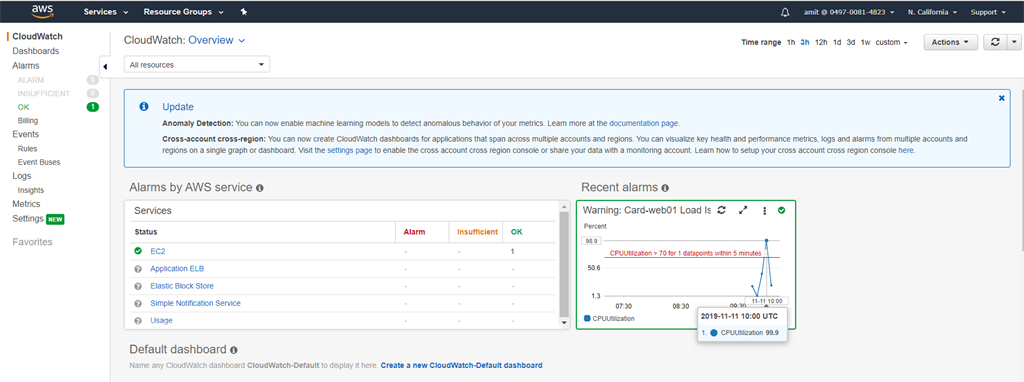
We can see that alarm has been generated and also have received an email for the same by SNS.
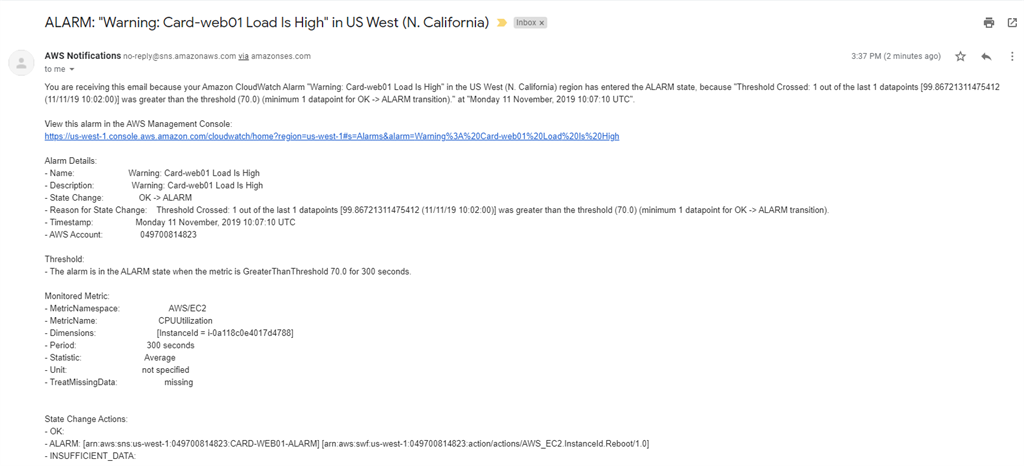
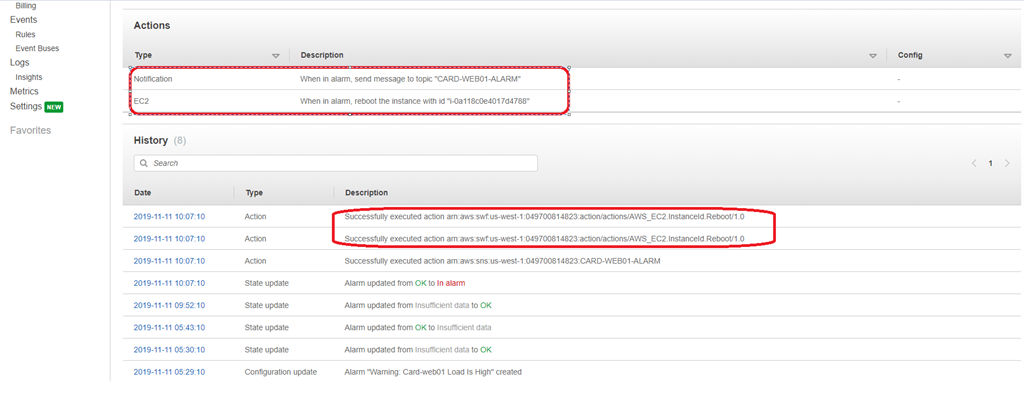
Let’s see the statistics of the alarm and the history and by looking the below screenshots we can see that after alarm SNS service has sent and email and the instance has been rebooted successfully.
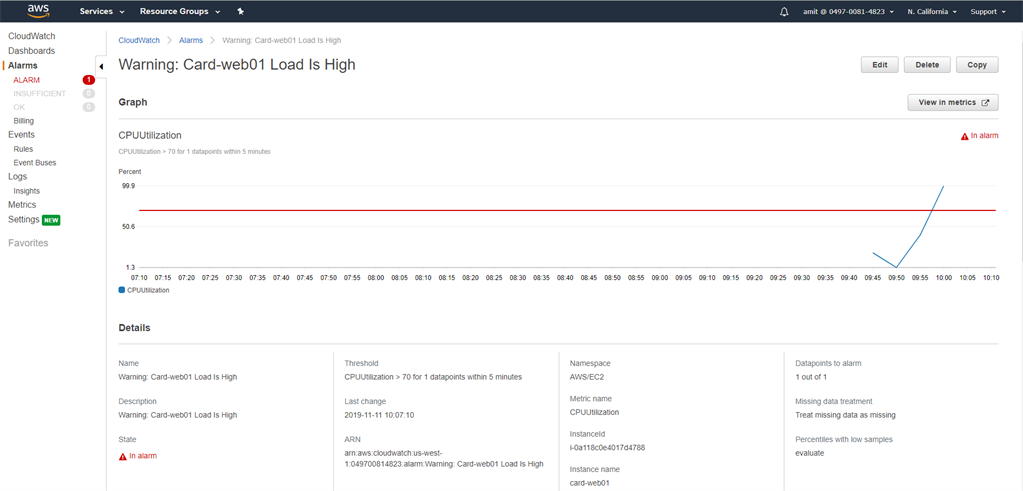
After the reboot of instance, CloudWatch dashboard looks something like this now, showing the recent alarm and current status as Ok.